Xtrace: an Oracle session trace browser – exec flow
Tracing a session is extremely useful when you need to investigate how a client interacts with the database – the client could be an application of yours, a third-party application, or an Oracle module such as dbms_stats or dbms_mview. To get the perfect picture of the client-server dialogue, you “simply” need to consider all EXEC lines in the trace file, and associate to each line the executed statement and the bind variable values; a very tedious and error-prone task when done manually, that Xtrace can make for you (and for free).
Let’s see the tool in action. Consider tracing a call to this stored procedure, that executes a recursive SQL statement :
[sql]
create or replace procedure test_proc( p_x int )
is
begin
for i in 1..p_x loop
for k in (select count(*) from t where x > i) loop
null;
end loop;
end loop;
end;
[/sql]
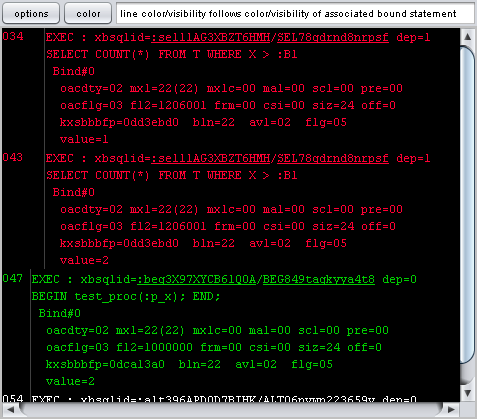
Here is the output of Xtrace:

Reading it bottom-up, you can see that the client called the SP, which in turn executed recursively (note the indentation) the SQL statement twice.
You can also ask Xtrace to display the bind variable values used for each execution:

So – the client passed the value “2” for :p_x to the SP, which in turn executed the SQL statement first passing “1” for :B1, and then passing “2”.
Interested ? Try it live (requires Java Web Start):
When Xtrace opens up, press the “options” button and then the “EXEC FLOW analysis” button. Enable/disable the bind variable values using the “display BINDS under EXEC” checkbox; color the statements as you like.
We introduced Xtrace in this post; the Xtrace home page contains the tool (which can be used online or downloaded) – and a manual for advanced uses.


Leave a Reply